
Page 50 - Corporate Responsibility Report 2018
P. 50
48
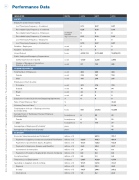
Performance Data
INDICATOR
SAFETY
Employee and Contractor Safety
Recordable Injury Frequency - Employees
Fatalities - Contractors
UNITS
2016
2017 2018
0.13
Recordable Injury Frequency - Combined
count per 200,000 exposure hours
0.26
0.30 0.16
0
00
Recordable Injury Frequency - Contractors
0.31
0.32 0.16
Lost Time Injury Frequency - Employees
0
00
Lost Time Injury Frequency - Contractors
Fatalities - Employees
count
0.10
0.07 0.07
0
00
count
1
00
Hours Worked
Public Safety and Emergency Preparedness
hours
Rate of New Employee Hires1 % 38.23
Voluntary Turnover Rates1 % 11.14
Total Number of Hours of Training in the Year (Colombia Only)
hours 808 23,862 10,299
Average Hours of Training per Year per Employee (Colombia Only)
hours/person 6 98 43
Female hours/person 6 75 58
4,558,133
8,733,985 10,974,872
Safety Inspections Conducted
count
1,329
2,200 2,950
Number of Emergency Simulations (Tabletop and In-Person)
HUMAN RESOURCES
Total Number of Employees count 404 400 404
count
Female count 219 161 159
Male count 185 239 245
Employees in Each Country
Colombia count 281 316 310
Canada count 76 84 94
Brazil count 22 0 0
Peru count 25 0 0
Employees Covered by Collective Bargaining Agreements % 0 0 0
87
135 295
Male hours/person 6 115 77
Average Age of Employees (Colombia)1 years 38
Average Age of Employees (Canada)1 years 45
ECONOMY
Economic Value Generated and Distributed2,1
millions of $
601.5 791.1
Payments to Suppliers, Contractors and Other Third Parties
millions of $
329.9
430.7 468.4
Payments to Governments (Taxes, Royalties)
millions of $
101.5
120.0 192.9
Payments to Employees (Salaries and Benefits)
millions of $
22.0
20.4 24.7
Investment in Communities
millions of $
2.8
8.2 9.1
Payments to Providers of Capital (Debt, Interest, Dividends)
millions of $
0.0
0.0 0.0
Social Investment
millions of $
2.8
3.3 2.4
Temporary Local Employment
contracts
1,907
4,929 4,776
Spending on Suppliers (only Colombia)
millions of $
161.5
321.6 314.7
Regional
Country
millions of $
29.0
55.3 44.0
millions of $
130.5
266.1 248.2
International
millions of $
1.8
0.2 22.4
Lost Time Injury Frequency - Combined 0.07 0.07
Notes: N/A: not available. | All monetary values are in USD. | Figures may differ slightly due to rounding. | *No untreated wastewater is discharged.
