
Page 51 - Corporate Responsibility Report 2018
P. 51
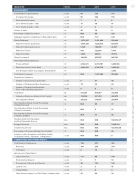
  INDICATOR
 UNITS
  2016
2017 2018
ENVIRONMENT
Total Number of Spill Incidents count 86 124 137
 49
    Contained Discharges count 66 104 116
Environmental Incidents count 7 8 6
Oil or Chemical Spills <1 bbl count 11 10 15
Oil or Chemical Spills >1 bbl count 2 2 0
Volume of Spills m3 40 16 9
Percentage of Spills Recovered % N/A 66 100
Aggregate Quantity of Significant or Reportable Spills m3 N/A 1.53 0.41
Water Withdrawal m3 1,071,297 1,301,886 954,246
Water from Rivers and Creeks m3 1,057,244 1,029,810 827,638
Water from Municipal Sources m3 5,526 100,995 43,707
Water from Trucks m3 919 122,063 3,183
Water from Wells m3 7,680 49,018 79,718
Water Discharged* m3 149,252 855,805 948,791
Other Water-Related Measures
Produced Water m3 2,543,031 2,772,567 3,465,984
Water Injected into Active Wells m3 2,461,987 2,790,716 3,445,921
Non-Enterprise Water Consumption (Head Office)1 m3 3,362
Total Water Consumed m3 N/A 1,301,886 954,246
Regulatory Compliance
Number of Inspections by Authorities count 6 41 46
Number of Findings and Non-Compliances count 19 38 24
Number of Findings that Resulted in Fines or Non-Monetary Sanctions
count 0 0 0
Total Waste kg 527,261 410,367 732,929
Hazardous Waste (as defined in the Country) kg 319,036 231,410 482,270
Non-Hazardous Waste kg 208,225 178,957 250,659
Non-Hazardous Waste Include Percentage of Waste Recycled
% N/A 69 31
Non-Hazardous Waste Include Percentage of Waste Incinerated
% N/A 0 21
Non-Hazardous Waste Include Percentage of Waste Landfilled
% N/A 31 48
     Energy Derived from Renewable and Non-Renewable Sources
kws N/A N/A 100,272,371
     Energy Purchased kws N/A N/A 7,429,134
     Total Electrical Power kws N/A N/A 107,701,505
     Percentage of Consumed Energy from the Grid % N/A N/A 20
     Incidents of Non-Compliance with Water Quality or Quantity Permits, Standards, or Regulations
count N/A N/A 0
  COMMUNITIES AND HUMAN RIGHTS
 Total Number of Grievances
   count
    189
  273 382
  Resolved
 count
  189
255 374
 In Progress
  count
   0
  18 8
 Grievances by Type/Subject
        Labour Practices
  count
   111
  90 149
 Environmental Impacts
   count
    8
   7 10
  Procurement of Goods and Services
 count
  48
125 140
 Land Access
  count
   2
  3 45
 Human Rights
  count
   0
  00
 Other Causes (Impacts on Third Parties, Infrastructure)
   count
    20
   48 38
 1In previous years this total was not calculated. 2Total includes all Capex, Opex, G&A, Acquisitions, Taxes and Royalties in 2018.
